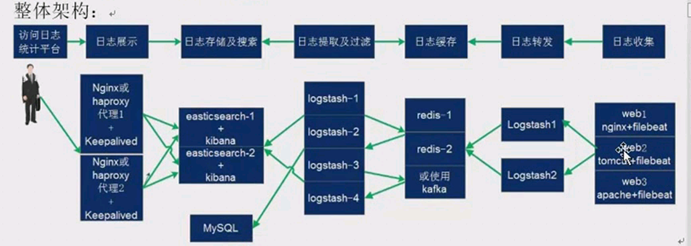
第1章 logstash 收集日志
1.1 logstash 收集system 系统日志
#提示因为收集messages 日志需要授权644
[root@elk1 log]# chmod 644 /var/log/message
# 编写logstash system.conf文件
[root@elk1 ~]# vim /etc/logstash/conf.d/system.conf
input {
file {
# 日志路径
path => "/var/log/messages"
# 日志名称
type => "systemlog"
#日志设置从哪里读 默认从尾数读
start_position => "beginning"
#刷新时间默认1秒,根据业务而定
stat_interval => "2"
}
}
output {
elasticsearch {
hosts => ["172.16.1.20:9200"]
index => "logstash-system-%{+YYYY.MM.dd}"
}
}
测试命令
[root@elk1 ~]# /usr/share/logstash/bin/logstash -f /etc/logstash/conf.d/system.conf -t
WARNING: Could not find logstash.yml which is typically located in $LS_HOME/config or /etc/logstash. You can specify the path using --path.settings. Continuing using the defaults
Could not find log4j2 configuration at path //usr/share/logstash/config/log4j2.properties. Using default config which logs to console
Configuration OK #成功后重启
20:16:13.658 [LogStash::Runner] INFO logstash.runner - Using config.test_and_exit mode. Config Validation Result: OK. Exiting Logstash
# 重新启动logstash
[root@elk2 ~]# systemctl restart logstash
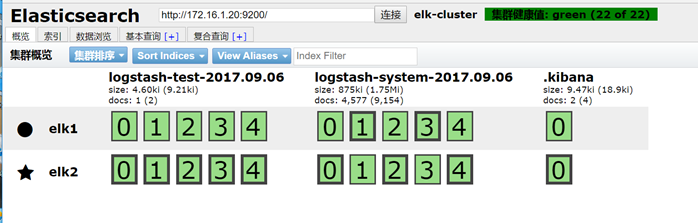
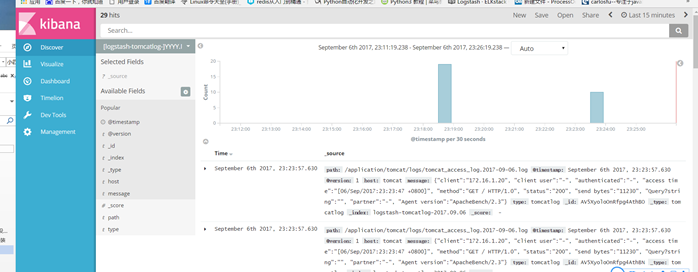
#查看在elasticsearch 中已经出现log
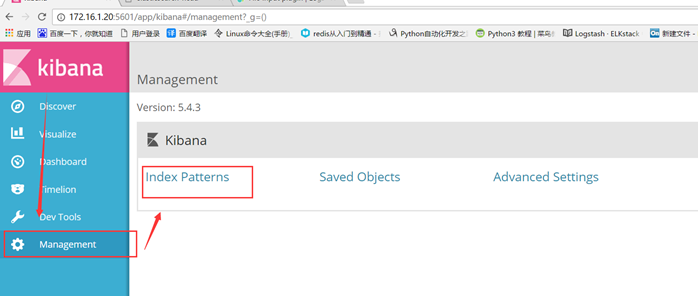
# 添加到kinaba
选择Management -> index patterns
# 点击小加号,创建添加 logstash
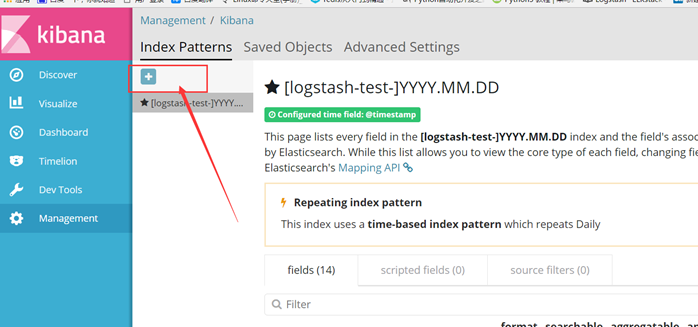
# 输入 名称[logstash-system-]YYYY.MM.DD
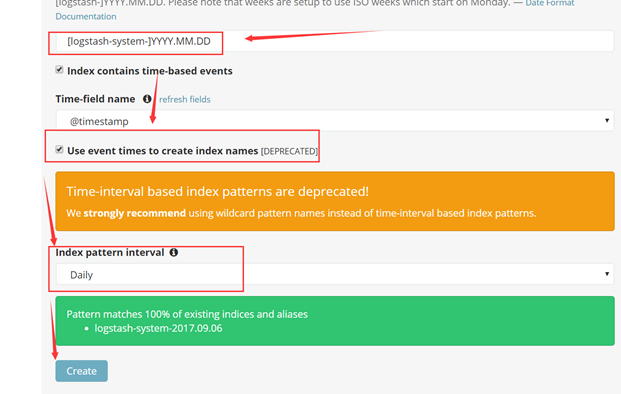
# Create创建后,会显示当前日志的一些信息,选择 Diiscover
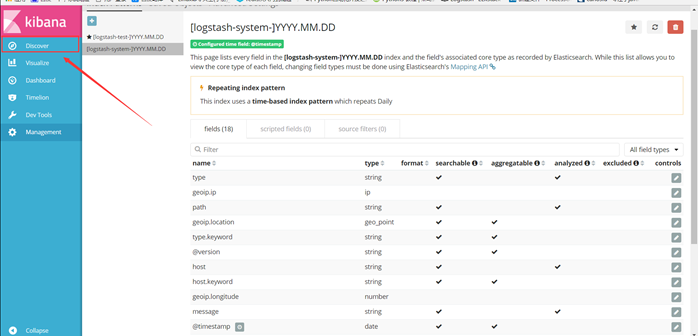
# 通过 左上交的下拉框找到自己需要打开的日志
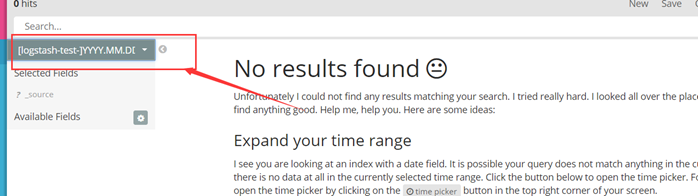
# 提示:如果没有日志记得选择组左上角选择时间,一定要记得 ELK 对时间 要求很高,要查看集群中ntp 时间是否一致。
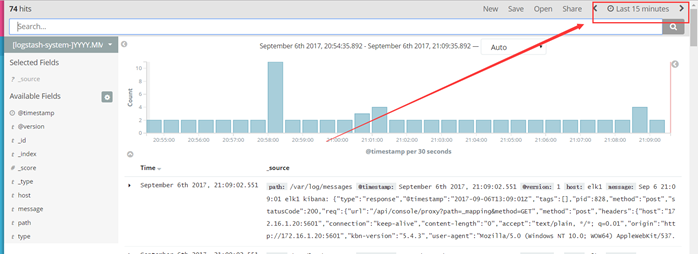
# 大概的日志 如下
1.1 logstash 收集 nginx access 日志
#提示主要配置如下。
[root@elk1 conf]# cat nginx.conf
worker_processes  1;
events {
    worker_connections  1024;
}
http {
    include       mime.types;
    default_type  application/octet-stream;
    sendfile        on;
    #定义成json 格式
    log_format json '{"@timestamp":"$time_iso8601",'
                 '"host":"$server_addr",'
                 '"clientip":"$remote_addr",'
                 '"size":$body_bytes_sent,'
                 '"responsetime":$request_time,'
                 '"upstreamtime":"$upstream_response_time",'
                 '"upstreamhost":"$upstream_addr",'
                 '"http_host":"$host",'
                 '"url":"$uri",'
                 '"xff":"$http_x_forwarded_for",'
                 '"referer":"$http_referer",'
                 '"agent":"$http_user_agent",'
                 '"status":"$status"}';
      #重要2:保存的目录绿色可以修改,红色默认
      access_log /application/nginx/logs/access.log json;
    keepalive_timeout  65;
    server {
        listen       80;
        server_name  localhost;
        location / {
            root   html;
            index  index.html index.htm;
        }
        error_page   500 502 503 504  /50x.html;
        location = /50x.html {
            root   html;
        }
    }
}
6.2.1 #注意事项1:如果公司还在用log_format main 注释或者删除
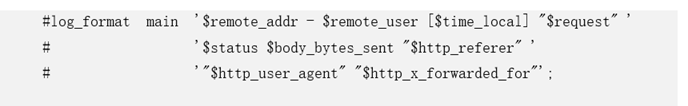
6.2.2 #注意事项2: 用nginx –t 检查,错误在修改
[root@elk1 conf]# /application/nginx/sbin/nginx -t
nginx: the configuration file /application/nginx-1.10.1/conf/nginx.conf syntax is ok
nginx: configuration file /application/nginx-1.10.1/conf/nginx.conf test is successful
6.3 logstash 收集 tomcat 日志
#修改地址
[root@tomcat logs]# vim /application/tomcat/conf/server.xml

#修改后
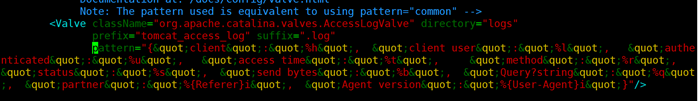
prefix="tomcat_access_log" suffix=".log"
pattern="{"client":"%h", "client user":"%l", "authe nticated":"%u", "access time":"%t", "method":"%r", "status":"%s", "send bytes":"%b", "Query?string":"%q" ;, "partner":"%{Referer}i", "Agent version":"%{User-Agent}i"}"/>
[root@tomcat logs]# cat /etc/logstash/conf.d/tomcat.conf
input {
  file {
     path => "/application/tomcat/logs/tomcat_access_log.*.log"
     type => "tomcatlog"
     start_position => "beginning"

 }
}
output {
  if [type] == "tomcatlog"{
  elasticsearch {
     hosts => ["172.16.1.20:9200"]
     index => "logstash-tomcatlog-%{+YYYY.MM.dd}"
  } }
}
#一样的添加kibana
1.1 logstash 收集 Java 日志
codec 的multiline 插件实现多行匹配,这是一个可以将多行合并的插件,而且可以使用what指定将匹配到的行与前面的行合并还是和后面的行合并。
多行插件multiline
官方网址 https://www.elastic.co/guide/en/logstash/2.2/plugins-codecs-multiline.html
写之前找日志的特点
1.1.1.1 测试列子
[root@elk1 ~]# vim /etc/logstash/conf.d/demo.conf
input {
  stdin {
  codec => multiline {
  pattern => "^\["
  negate => true
what => "previous"
  }
 }
}
output {
  stdout {
  codec => "rubydebug"
 }
}
# 执行测试
[root@elk1 ~]# /usr/share/logstash/bin/logstash -f /etc/logstash/conf.d/demo.conf
#通过查看 日志发现已 [ 括号开头就会合并成一行
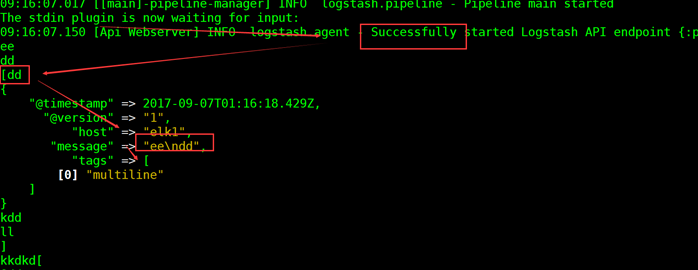
[root@elk1 ~]# /usr/share/logstash/bin/logstash -f /etc/logstash/conf.d/demo.conf
WARNING: Could not find logstash.yml which is typically located in $LS_HOME/config or /etc/logstash. You can specify the path using --path.settings. Continuing using the defaults
Could not find log4j2 configuration at path //usr/share/logstash/config/log4j2.properties. Using default config which logs to console
09:16:06.918 [[main]-pipeline-manager] INFO  logstash.pipeline - Starting pipeline {"id"=>"main", "pipeline.workers"=>2, "pipeline.batch.size"=>125, "pipeline.batch.delay"=>5, "pipeline.max_inflight"=>250}
09:16:07.017 [[main]-pipeline-manager] INFO  logstash.pipeline - Pipeline main started
The stdin plugin is now waiting for input:
09:16:07.150 [Api Webserver] INFO  logstash.agent - Successfully started Logstash API endpoint {:port=>9600}
ee
dd
[dd
{
    "@timestamp" => 2017-09-07T01:16:18.429Z,
      "@version" => "1",
          "host" => "elk1",
       "message" => "ee\ndd",
          "tags" => [
        [0] "multiline"
    ]
}
kdd
ll
]
kkdkd[
6.4.2 案例:收集Java 日志
input {
   file {
    path => "/home/yunwei/tools/java.log"
    type => "java_log"
    start_position => "beginning"
    codec => multiline {
# 正则表达式,当遇到[ 开头的时候进多行合并
    pattern => "^\["
    # 为匹配成功进行操作,false 为不成功进行操作。
    negate => true
    # 与上面的行合并
    what => "previous"
    }
  }
output {
if [type] == "java_log"{
    elasticsearch {
    hosts => ["172.16.1.61:9200"]
    index => "java_log-%{+YYYY.MM.dd}"
    }
  }
}
6.5 logstash 收集TCP
下载 NetCat 简称nc,其功能实用,简单、可靠的网络工具,可通过TCP或UDP协议传输读写数据,另外还具有许多其他功能。
[root@elk1 ~]# yum install nc –y
6.5.1 测试tcp.conf
[root@elk1 ~]# cat /etc/logstash/conf.d/tcp.conf
input {
  tcp {
    port => 5600
    mode => "server"
    type => "tcplog"
  }
}

output {
  stdout{
  codec => rubydebug
 }
}
# 执行
[root@elk1 ~]# /usr/share/logstash/bin/logstash -f  /etc/logstash/conf.d/tcp.conf

# 出现Successfully started Logstash API endpoint {:port=>9600} 后使用nc测试
[root@elk1 ~]# echo "tcptest"|nc 172.16.1.20 5600
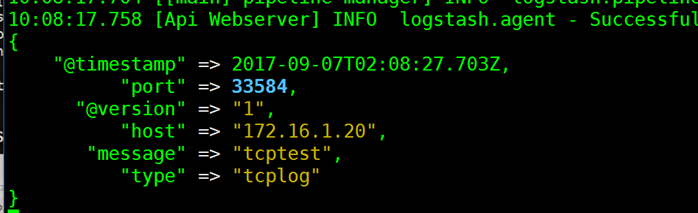
测试解决,停止后修改tcp.conf 写入
1.1.1 案例:logstash 收集TCP
[root@elk1 ~]# cat /etc/logstash/conf.d/tcp.conf
input {
  tcp {
    port => 5600
    mode => "server"
    type => "tcplog"

  }
}
output {
  if [type] == "tcplog"{
  elasticsearch {
     hosts => ["172.16.1.20:9200"]
     index => "logstash-tcplog-%{+YYYY.MM.dd}"
  } }
}
# 写入后 –t 测试
[root@elk1 ~]# /usr/share/logstash/bin/logstash -f /etc/logstash/conf.d/tcp.conf -t
WARNING: Could not find logstash.yml which is typically located in $LS_HOME/config or /etc/logstash. You can specify the path using --path.settings. Continuing using the defaults
Could not find log4j2 configuration at path //usr/share/logstash/config/log4j2.properties. Using default config which logs to console
Configuration OK
10:14:28.727 [LogStash::Runner] INFO  logstash.runner - Using config.test_and_exit mode. Config Validation Result: OK. Exiting Logstash
# ok 后重启 logstash
[root@elk1 ~]# systemctl restart logstash
6.6 logstash 收集 syslog
#  编辑/etc/rsyslog.conf  62行加入监听 514端口
[root@linux-node1 etc]# vim /etc/rsyslog.conf
*.*                                                     @@172.16.1.61:514
input {
    tcp {
        port => 514
        type => syslog
    }
    udp {
        port => 514
        type => syslog
    }
}
output {
    elasticsearch { hosts => ["localhost:9200"] }
    stdout {  }
}

配置文件说明:
输入
设置监听TCP/UDP的514端口,类型是rsyslog。
这样配置后logstash服务启动时将会作为1个rsyslog服务器接收来自其他rsyslog的日志。
输出:
将日志输出到本地的elasticsearch,
同时,将收到的日志打印到标准输出。
备注:
此处的tcp、udp端口只能设置为514,亲身测试过其他端口,存在问题,原因目前未知。